Whether you're creating surveys for just your team or for your whole organization, there's a pretty good chance that you'd want to take a look at your results through different lens. While having all results display is important for a high-level overview, sometimes it's helpful to filter and compartmentalize your results. You may even find that you uncover insights that you wouldn't have been able to see before with the raw results.
Results from your polls and surveys have always been displayed in total with all responses and had the inability for advanced filtering – until now. We're so pleased to announce that you can now slice and dice your data on your dashboard in an interactive way with advanced filtering. The ways in which you could filter your data is endless so that you can dig into the areas of your organization that need the most attention. Filtering of your results makes visualization of your data more clear and crisp, and is specifically tailored to what you're looking for.
What sort of filters can I apply?
Question and Answer filter logic
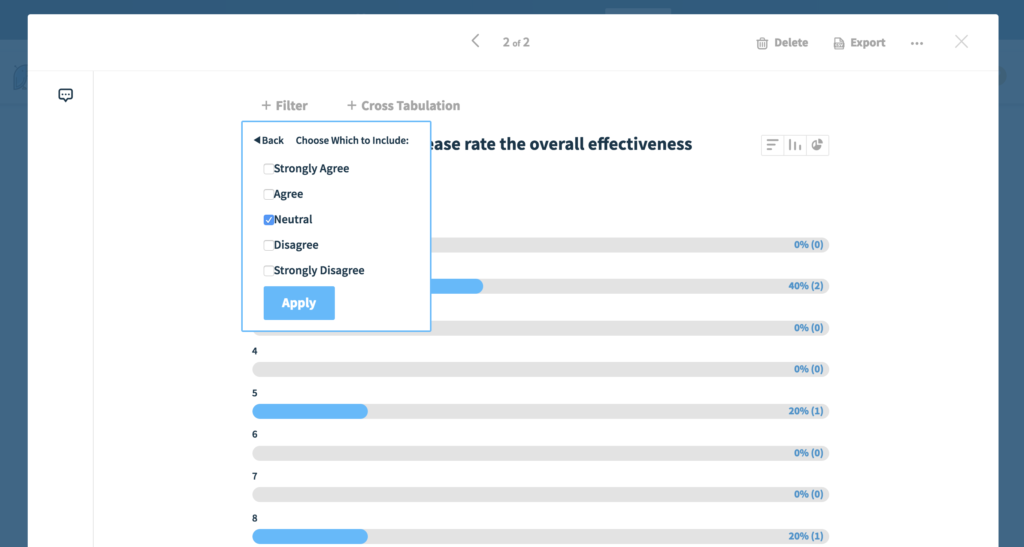
While the positive feedback from your colleagues' survey responses are always great, the areas you'd want to look for improvements are the responses that were either negative or neutral, and how those people answered other questions in your survey.
For example, say you've created a survey for your team asking for anonymous feedback on how your last All Hands meeting went. You want to drill into the survey results based on the people that answered that the execution of the meeting went poorly. This gives you a better insight into how those specific people then answered the other questions, without having to do any guess work.
This is just one of the many examples of question & answer logic filtering, where you can filter all responses based on a selected response to a question.
Audience Attributes
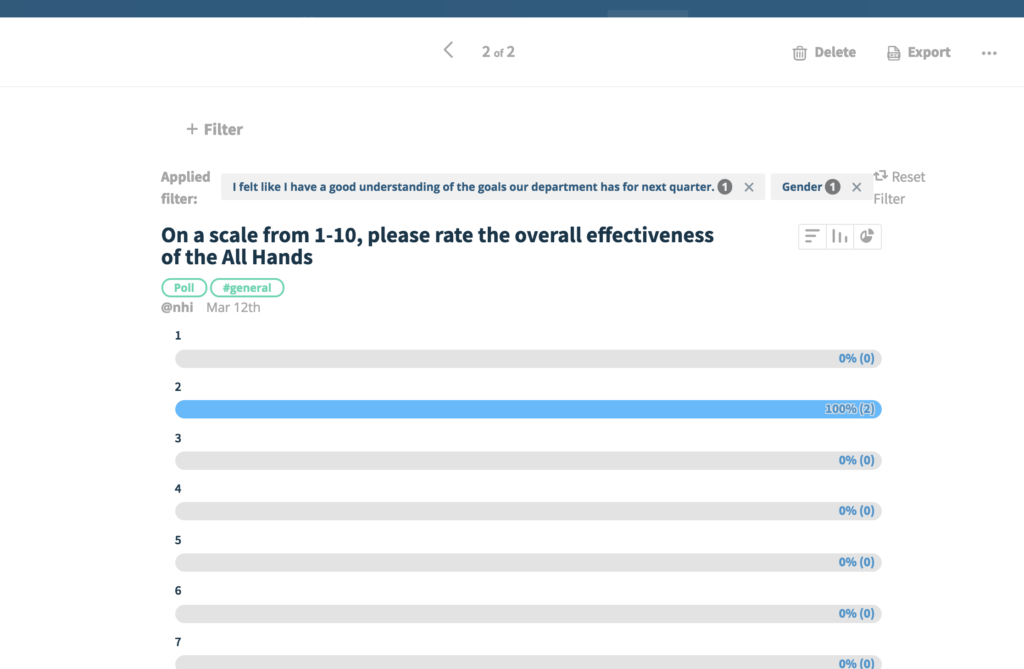
Based on the segments you've imported from a CSV file, you can filter by your geographic location, FT/PT, function, tenure, gender, age... the sky's the limit when it comes to audience segments. You can drill down into specific attributes for a poll or survey result and make connections between audience attributes and survey responses.
You're not limited to just one segment at a time, either. You can filter your survey results by multiple attributes – say you want to filter your results to just the Marketing department, the Sales department, and those that have been at their jobs for at least 2 years. Everyone else that is not in either Sales or Marketing and have been at their job less than 2 years, will be excluded from the results view.
User groups (coming soon)
Similarly to audience attributes, you can filter your data with your pre-defined Slack user groups. While there may be overlap with whether you should create a user group or include the attribute in your CSV upload, there are some cases in which attributes may be more appropriate than user groups since user groups are public and anyone can use them (in Slack, and in Polly).
More sensitive and individual-based data are more appropriate for audience attributes, such as salary, age, manager, and hire date. User groups tend to be applied to a number of people – such as primary office location or the department that they work in.
How do filters work in Polly?
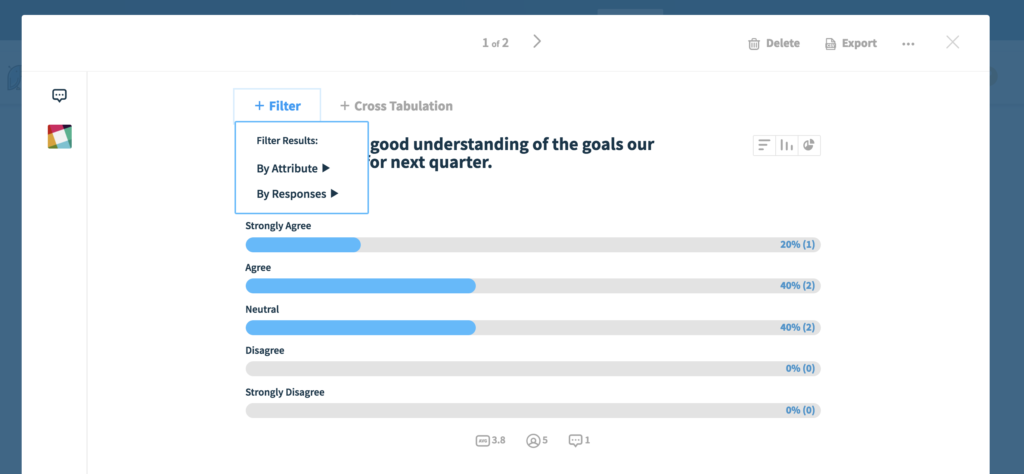
Filtering your results currently is only available from the poll/survey detail view and can easily be done in a few clicks. Upon selecting the desired results, just hit Filter and choose the type of filter you would want to filter by, whether that's Question and Answer, Audience Attribute, or by User Group.
Once you've done that, the drop down will show the options available for your choice. If you don't have any audience attributes or user groups already set at the time of the filter creation, then the drop-down will be empty and it will prompt you to create your segments within the Segmentation tab.
As soon as you select and apply the filter, the graphs will change dynamically based on the filters that you have applied. If you wish to export the exact results from the filters you've applied, you can do so – just note that since you can only apply filters on the detailed view, it will only export that single poll/survey instance, or the recurring track.
Where can I find more information?
Have questions, or interested in learning more about what you can unlock with advanced filters in Polly? Visit our help pages on advanced filters where we (hopefully) answer everything there is to know about advanced filters.
Not sure how to get started with advanced filters for your team or organization? Check out our step-by-step guide to using advanced filters.
As always, we're more than happy to help! Just drop us a line at contact@polly.ai and we'll get back to you in no time.

Written by Nhi Nguyen
Professional Netflix binge-watcher. Wants to see all of the world.
